
User journeys are here
Issue 11 · Nov 11, 2026
User journeys are here
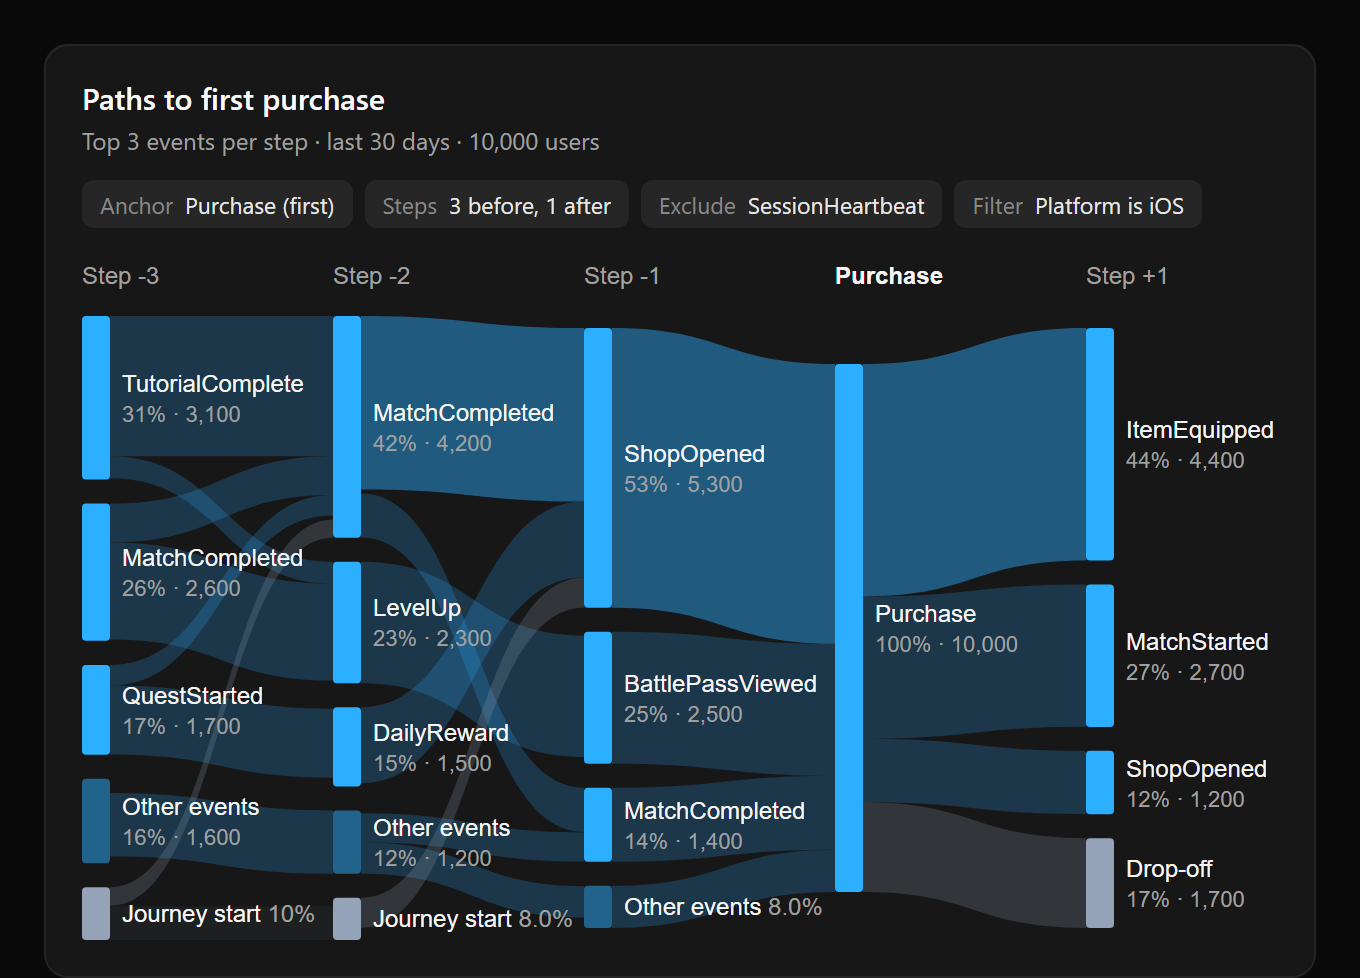
Pick any event to see the paths users take to reach it and what they do next. Chain up to four events, filter and break down by any property, hide noisy events, and right-click any step to dig in. The assistant can build journeys too.
Journeys have been on our roadmap for a long time, and your feedback shaped what they became. Thank you to every studio who asked for them and told us what they needed.
Show anyone Gamebeast with the Beast Brawl demo
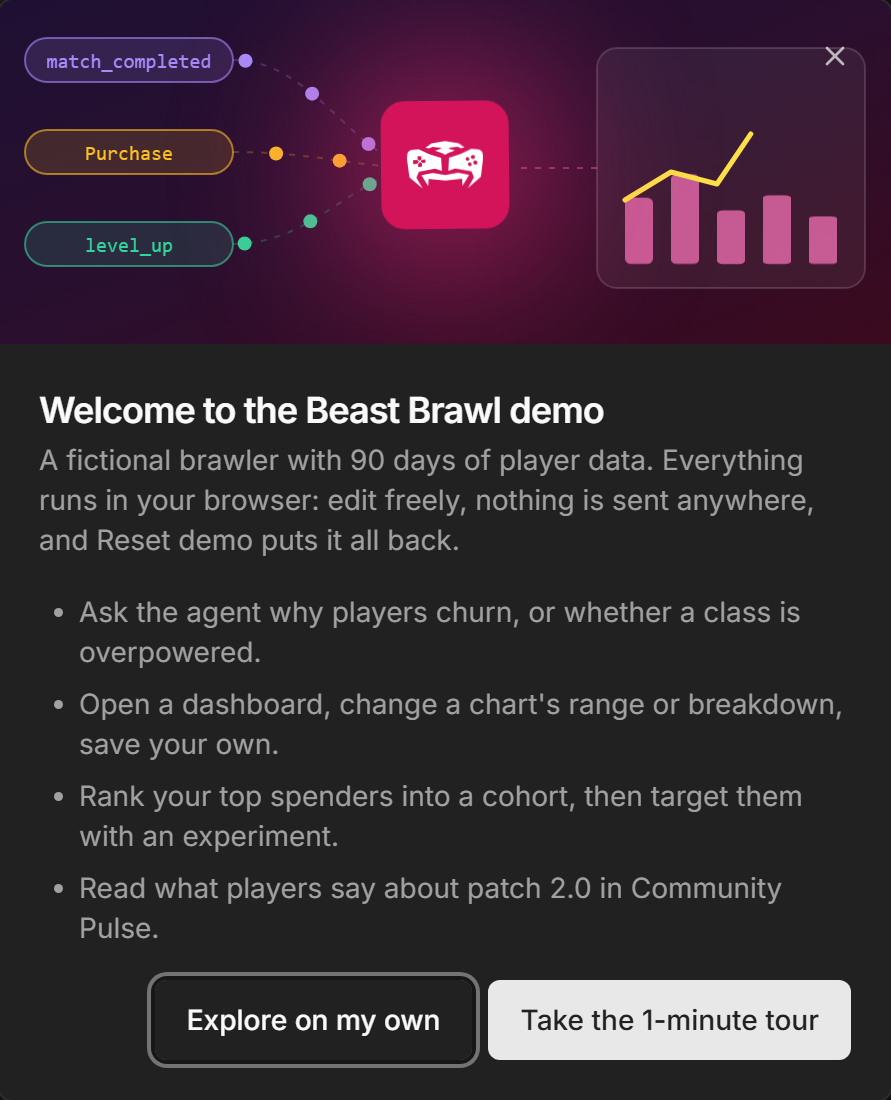
demo.gamebeast.gg is a full Gamebeast project for a fictional brawler with 90 days of data. There’s no sign-up and it runs in your browser, so send it to anyone who wants to see Gamebeast before they get access.
See who changed what, and when
The Audit log records every change across your organization, whether it was made by a person, an API key, or an AI agent like the assistant, with every field’s value before and after.
Also on the way
Community Pulse for every studio
Pulse reads what your users are saying in Discord, in-game comms, or any other channel you choose to connect, and turns it into topics and sentiment you can chart, build cohorts from, and target with experiments. Users who complain about slow progression could get an experiment with faster progression.
Histograms
A chart for how a value is spread across users, not just its average.
Share links
Turn any chart into a read-only link, with an optional PIN, that embeds in Discord, Slack, or anywhere on the web.
Smaller things worth knowing
Change targeting after an experiment starts. Add players, values, or conditions to a scheduled or active experiment, and nobody switches groups. How it works.
A cohort fix that may change your counts. Cohorts with several “did not” conditions in one AND group now exclude users who match any of them, as intended.
Faster, cleaner dashboards. Cohort and new-user charts run up to about 3x faster, metric tiles have a cleaner layout, and tiles load top to bottom.