
Query Builder
Turn the markers your experience sends into charts: pick a query type, choose what to measure, filter and break it down, set the time range, and save it to a dashboard.
The query builder is how you turn the markers sent to Gamebeast from your experience into charts. You choose what to measure, filter and group it, pick a time range and visualization, and save the result as a query on a dashboard.
Query types
Pick the kind of query from the tabs at the top of the query setup:
Insight
Count events, players and values over time or across a range. Most charts are insights.
Funnel
See how many players get through a series of steps, and where they drop off.
Heatmap
See where in your world an event happens, drawn over your map.
Retention
See how many players come back after doing something.
Insights can also combine their metrics with formulas.
The rest of this page covers what every query type shares: filters, breakdowns, time, and saving.
Creating a query
Open a dashboard, click Edit, then Add panel → Query. The query builder opens with the query setup on one side and a live preview of the chart on the other, which updates as you go. When you save the query, it's added to the top of the dashboard and you're returned to it with your other unsaved edits intact.
To change an existing chart, choose Edit from its ⋮ menu.
What you measure depends on the query type: metrics in an insight, steps in a funnel, a start and return event in retention. See each type's page for the details.
Filters
Filters limit which events a query counts. There are two kinds, and they use the same conditions.
Global filters
Global filters apply to every metric (or step) in the query. Click the + beside Global Filters. Use them when the condition applies to the whole question, such as "players on mobile".
Local filters
Local filters apply to one metric (or step) only. Click the filter icon on a metric, or choose Filter from its ⋯ menu. Use them when only one metric should be limited, such as "purchases of the starter pack" next to all sessions. With more than one local filter, choose whether events must match and all of them or or any of them.
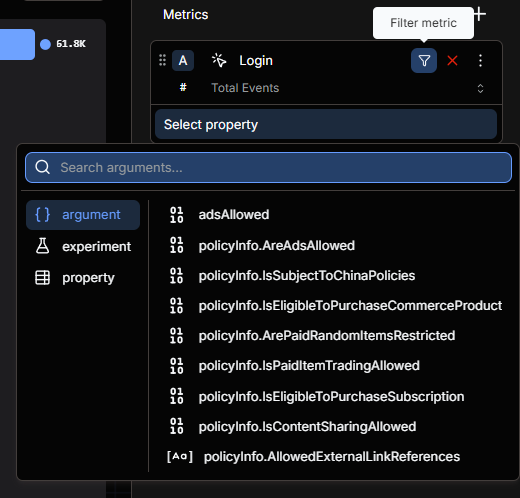
What you can filter by
| Tab | Filters by |
|---|---|
| Argument | The custom arguments you send with your markers, such as Level or ItemName. |
| Property | Information Gamebeast records with every marker, such as Country, Device and Language, plus your custom properties. Nested properties open a level at a time. |
| User | New User: only events from each player's first-ever session. First Occurrence: only each player's first-ever occurrence of the event. User ID: specific players. |
| Cohort | Players who are (Is in) or aren't (Is not in) in one of your user cohorts. Create cohort at the bottom of the tab makes a new one. |
| Experiment | Players in an experiment or in some of its groups, or in any or no experiment. |
| Deeplink | Events attributed to a deeplink (Was Used), or not (Was not Used). |
A global filter on an argument or property only works if every metric's event has it. If one doesn't, the filter shows Argument does not belong to all metrics selected: use a local filter on the metrics that have it instead.
Conditions
| Type | Conditions |
|---|---|
| Text | Is, Is not, Contains, Does not contain |
| Number | Equal, Not equal, Greater than, Greater than or equal to, Less than, Less than or equal to, Between, Not between |
| True/false | True or False |
| Date | In the last, Not in the last, Between, Not between, On, Not on, Before, Since |
| List | Some, Every or None of the items match a condition, or the list's Length (plus Average, Sum, Minimum, Maximum for numbers) |
Every type also has Exists and Does not exist, for whether the event has the value at all. Is, Contains and Equal accept several values, and an event matches if it matches any of them. Is not, Does not contain and Not equal exclude every value you list.
A filter with no value is ignored and highlighted, and isn't saved.
New players vs. new events
New User and First Occurrence answer different questions:
- New User keeps only what players did in their first session. "Purchases by new users" counts purchases made during each player's first session.
- First Occurrence keeps only the first time each player sent the event, whenever that was. "First purchases" counts each player's first purchase, even if it was weeks after they joined.
Neither means "players who joined recently, in all their sessions since". For that, use a cohort.
Breakdowns
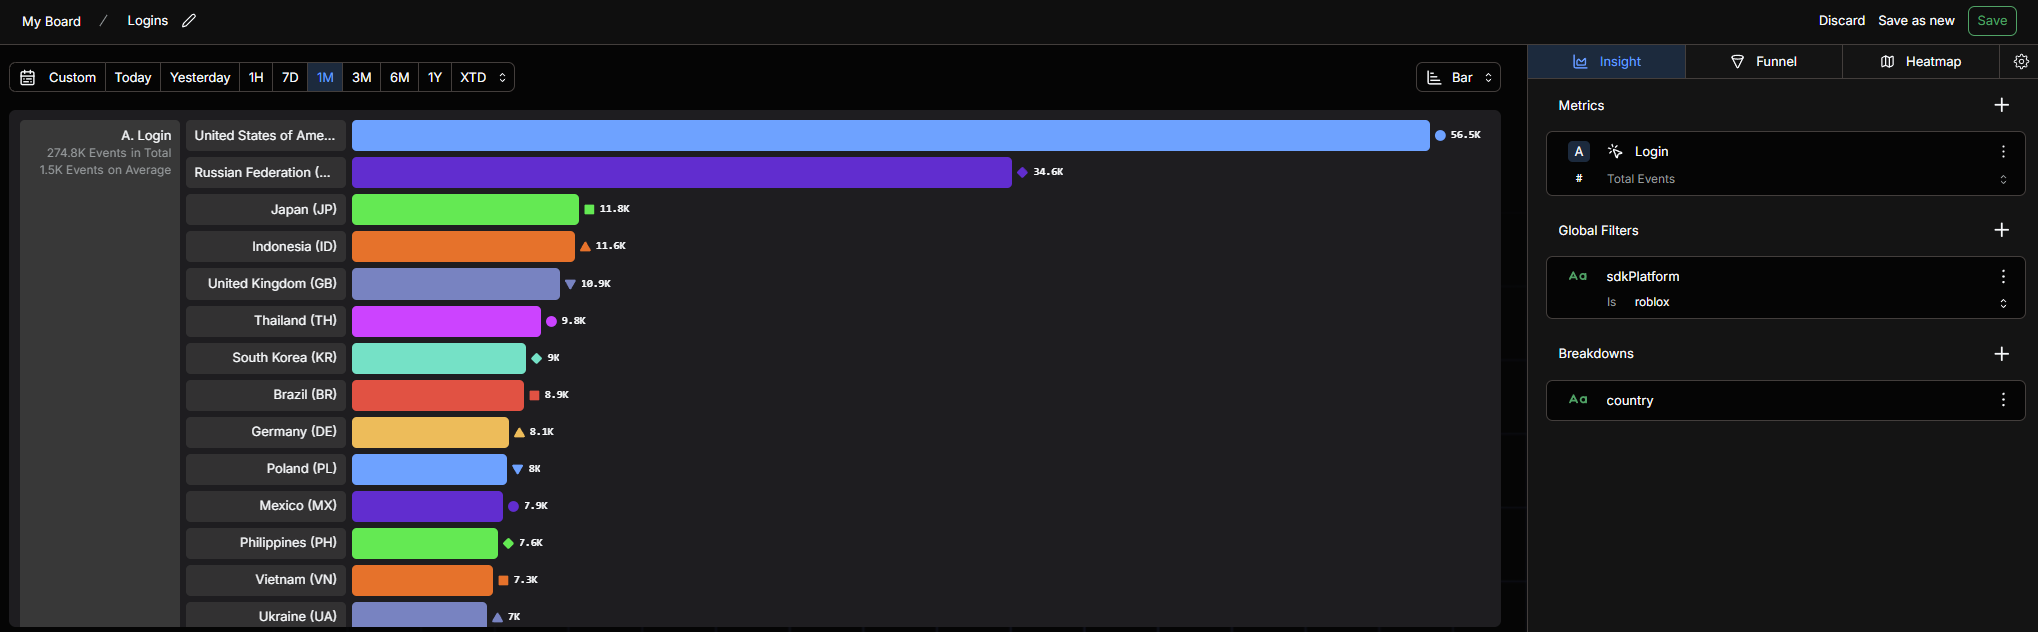
A breakdown splits every metric by the values of a property, argument, cohort, experiment or deeplink, with one series for each value. Click the + beside Breakdowns.
For example, breaking down session_start by Country shows how many players joined from each country:
- Several breakdowns nest: by
CountrythenDevicegives one series per combination, such as France / Mobile. - New User and First Occurrence break results into true and false, for new vs. returning players or first vs. repeat events.
- Cohort breaks results into players in and not in the cohort.
- Experiment gives one series per group, plus players not in the experiment. Choose All experiments for one series per experiment.
- Filter by, in a breakdown's ⋯ menu, adds a global filter on the same property, so you can pick which values to keep.
Break down by things with a handful of values, like country, platform or item. Breaking down by something unique to each player, like a player ID, produces one series per player.
Limiting and sorting breakdown values
Open a breakdown's ⋯ menu to add:
- Limit: keep only the top (or bottom) 10, 25, 50, 100 or a custom number of values, up to 1,000. With several metrics, choose which metric decides the top values. The values that don't make the cut are grouped into an Other series.
- Sort: order the values By value (largest or smallest first) or By name (A → Z or Z → A).
Without a limit, a breakdown keeps up to 1,000 values, and the chart shows the first 10 series. Click a series in the legend to show or hide it.
Time
Time range
Above the chart, pick a range: Today, 1H, 7D, 1M or 3M, or open the range picker for more:
- Presets: from Last 15 minutes to Last year, plus Week to Date, Month to Date, Quarter to Date and Year to Date.
- Last: a rolling window, such as the last 14 days. It moves forward with time, so the chart always shows the most recent period.
- Since: from a date until now.
- Fixed: between two dates. The chart always shows that period.
On a dashboard, a query can follow the dashboard's range: choose Default to use it.
Granularity
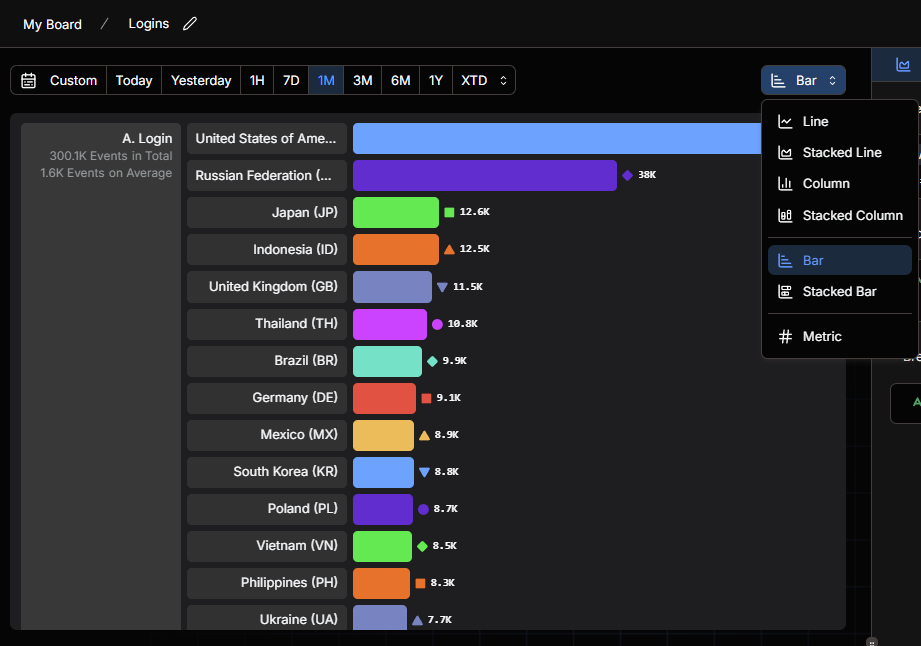
Time charts (Line, Stacked Line, Column and Stacked Column) show one point per Minute, Hour, Day, Week, Month, Quarter or Year. Changing the time range picks a suitable granularity for you, and you can change it after. Granularities that would produce too many points for the range are disabled.
Drag across a time chart to zoom in. Click Reset Zoom to go back.
Timezone
Days, weeks and months start at midnight in the query's timezone, which is your project's timezone by default. Choose another from the timezone picker, such as your local timezone or UTC, to see days as players in another region experience them.
Visualization
Pick how to show the results from the chart types above the preview. Each query type offers the charts that suit it. See Insights for the full list.
Saving a query
Give the query a name and click Create. To add a description, click the ⚙ beside the query types at the top of the query setup. The description shows under the chart's title on every dashboard it's on. A saved query records who created it and when it was created and last edited; hover the ⓘ beside the chart's title to see them.
When you edit a saved query, Save updates it and Save as new keeps the original and saves your changes as a copy. Discard throws away your changes. If the query can't be saved yet (a metric with no event, a filter on an argument that doesn't exist, an unfinished formula), hover the save button to see why.
A query can appear on more than one dashboard. Editing it changes it everywhere. See Dashboards for arranging, sharing, refreshing and exporting your charts.
With the assistant
The assistant can build any query type from a description, such as "a funnel from tutorial start to first purchase" or "daily players by country". It runs the query, shows you the chart, and can open it in the builder or add it to a dashboard. Agents connected over MCP can do the same.
Dashboards
Dashboards collect your saved queries, notes, headings and images on a grid you arrange yourself, organized into folders in the sidebar, and can be shared with anyone through a public link.
Insights
Chart how often something happens, how many players do it, and how much of something they spend or earn, over time or across a whole range, with filters, breakdowns and formulas.